05. Interactive Test Bench
The Interactive Test Bench (Test Bench tab) is a developer and operator diagnostic playground for interactively testing backend MCP tools, reading virtual resources, evaluating prompt templates, simulating semantic vector search, executing raw JSON-RPC payloads, and inspecting real-time diagnostic logs.
🎛️ Test Bench Overview & Layout
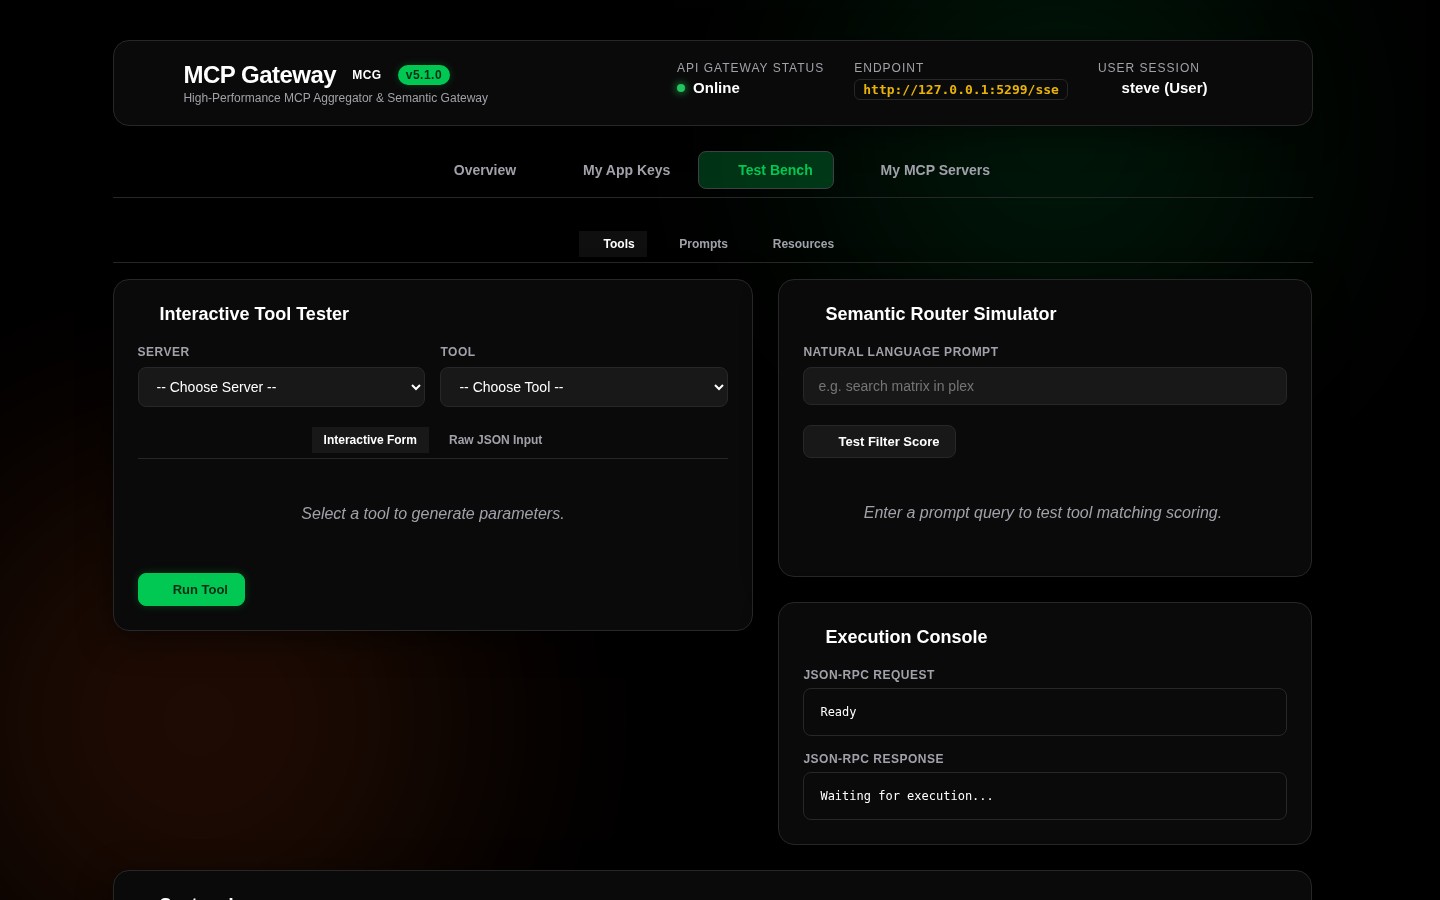
The Test Bench aggregates six specialized diagnostic tools in an interactive multi-panel layout:
+---------------------------------------------------------------------------------------------------------------+
| 🧪 Interactive Test Bench                                                                                     |
+---------------------------------------------------------------------------------------------------------------+
|  [ 🛠️ Tools ]   [ 📄 Resources ]   [ 💬 Prompts ]   [ 🧠 Semantic Router ]   [ 💻 Console ]   [ 📟 Logs ]     |
+---------------------------------------------------------------------------------------------------------------+
|                                                                                                               |
|  [ Active Tester Panel: Dynamic Forms, Schema Builder, Raw Arguments Editor, & Execution Controls ]          |
|                                                                                                               |
+---------------------------------------------------------------------------------------------------------------+
| 📟 Live Diagnostic Logs & Gateway Terminal                                                                     |
+---------------------------------------------------------------------------------------------------------------+
🛠️ 1. Tool Execution Tester (ToolTesterCard)
The Tool Tester allows direct interactive execution of any discovered or custom namespaced tool across connected servers without needing an external AI client or IDE.
+-------------------------------------------------------------------------------+
| 🛠️ Tool Execution Tester                                                      |
+-------------------------------------------------------------------------------+
| Target Server: [ docker (Docker Infrastructure Daemon) ▾ ]                    |
| Tool Name:     [ docker__restart_container ▾             ]                    |
|                                                                               |
| Parameters (Generated from JSON Schema):                                      |
|   Container ID / Name (*): [ homewebservice                                 ] |
|   Timeout Seconds:         [ 30                                             ] |
|                                                                               |
| [ ▶ Execute Tool ]                                                            |
+-------------------------------------------------------------------------------+
| Result (200 OK - 42ms):                                                       |
| {                                                                             |
|   "content": [                                                                |
|     { "type": "text", "text": "Container homewebservice restarted successfully" }|
|   ]                                                                           |
| }                                                                             |
+-------------------------------------------------------------------------------+
How to Use the Tool Tester
- Select Target Server: Pick the server from the dropdown (e.g.
docker,contextcortex,plex, orcustom). - Select Tool: Choose a tool belonging to that server. The UI automatically populates the form controls matching the tool's JSON Schema.
- Fill Parameters:
- Booleans: Rendered as interactive toggles/checkboxes.
- Strings & Numbers: Rendered as typed input boxes.
- Arrays & Objects: Enter valid JSON strings (e.g.,
["item1", "item2"]or{"key": "value"}). - Optional - Raw JSON Mode: Toggle the Raw JSON Editor to edit the complete parameter payload directly:
- Execute: Click Execute Tool. The request is dispatched, and the formatted response with execution status is displayed in the output console.
API & cURL Examples
The Test Bench interacts with either POST /api/test/call or POST /api/test/call-tool. Both canonical and alias routes are supported.
Standard Invocation with serverId and toolName:
curl -X POST http://localhost:8080/api/test/call \
  -H "Authorization: Bearer <YOUR_APP_KEY>" \
  -H "Content-Type: application/json" \
  -d '{
    "serverId": "docker",
    "toolName": "docker__restart_container",
    "arguments": {
      "container_id": "homewebservice",
      "timeout": 30
    }
  }'
Alias Invocation with Unnamespaced Name Resolution:
curl -X POST http://localhost:8080/api/test/call-tool \
  -H "Authorization: Bearer <YOUR_APP_KEY>" \
  -H "Content-Type: application/json" \
  -d '{
    "name": "docker__restart_container",
    "arguments": {
      "container_id": "homewebservice"
    }
  }'
📄 2. Virtual Resource Tester (ResourceTesterCard)
Inspect and read virtual MCP resources exposed by backend servers:
+-------------------------------------------------------------------------------+
| 📄 Virtual Resource Tester                                                    |
+-------------------------------------------------------------------------------+
| Target Server: [ docker ▾ ]                                                   |
| Select Resource: [ Container Status (mcp://docker/containers/status) ▾ ]      |
| Resource URI:  [ mcp://docker/containers/status                             ] |
|                                                                               |
| [ 📖 Read Resource ]                                                          |
+-------------------------------------------------------------------------------+
| MIME Type: application/json | Size: 1.4 KB                                    |
| {                                                                             |
|   "containers": [                                                             |
|     { "name": "caddy", "status": "running", "uptime": "14d 2h" },             |
|     { "name": "vault", "status": "running", "uptime": "30d 6h" }              |
|   ]                                                                           |
| }                                                                             |
+-------------------------------------------------------------------------------+
How to Use the Resource Tester
- Select Server or Template: Choose a server to filter its declared resources and URI templates.
- Select Resource or Enter URI: Select a known resource from the dropdown or manually type any custom URI (e.g.
mcp://docker/logs/caddyorrouter://database). - Read Resource: Click Read Resource to execute the query.
Supported Resource Types
- Backend MCP Resources: URIs adhering to
mcp://{serverId}/{path}. - Router System Resources:
router://status: Returns live gateway runtime health, active sessions, and connection pools.router://database: Returns active database metadata and server configurations.logs://recent: Retrieves the most recent in-memory log entries.
API & cURL Example
curl -X POST http://localhost:8080/api/test/resources/read \
  -H "Authorization: Bearer <YOUR_APP_KEY>" \
  -H "Content-Type: application/json" \
  -d '{
    "uri": "mcp://docker/containers/status"
  }'
💬 3. Prompt Template Tester (PromptTesterCard)
Evaluate parameterized prompt templates exposed by backend servers or custom file specifications:
+-------------------------------------------------------------------------------+
| 💬 Prompt Template Tester                                                     |
+-------------------------------------------------------------------------------+
| Target Server:   [ notes-rag (SilverBullet / Notes MCP) ▾ ]                   |
| Prompt Template: [ summarize_architecture ▾               ]                   |
|                                                                               |
| Arguments:                                                                    |
|   Topic (*):     [ Model Context Gateway Security Hardening                 ] |
|   Max Length:    [ 500                                                      ] |
|                                                                               |
| [ 📑 Render Prompt ]                                                          |
+-------------------------------------------------------------------------------+
| Rendered Messages:                                                            |
| [System]: "You are an expert systems architect reviewing homelab security..." |
| [User]:   "Summarize the architecture for Model Context Gateway Security..."  |
+-------------------------------------------------------------------------------+
How to Use the Prompt Tester
- Select Server & Template: Select the upstream server and the prompt template name.
- Fill Arguments: Enter the argument values required by the template schema.
- Render Prompt: Click Render Prompt. The gateway evaluates the template and displays the rendered conversation turn messages (roles, text, and attachments).
API & cURL Example
curl -X POST http://localhost:8080/api/test/prompts/get \
  -H "Authorization: Bearer <YOUR_APP_KEY>" \
  -H "Content-Type: application/json" \
  -d '{
    "serverId": "notes-rag",
    "promptName": "summarize_architecture",
    "arguments": {
      "topic": "Model Context Gateway Security Hardening",
      "max_length": "500"
    }
  }'
🧠 4. Semantic Router Simulator (SemanticRouterCard)
Simulate how the router's vector embedding engine scores and ranks tools when an AI agent calls search_tools:
+-------------------------------------------------------------------------------+
| 🧠 Semantic Search Simulator (Meta-Mode Test)                                 |
+-------------------------------------------------------------------------------+
| Natural Language Query: [ restart web proxy container                       ] |
| Search Limit:           [ 5 ▾ ]                                               |
|                                                                               |
| [ 🔍 Simulate Semantic Search ]                                               |
+-------------------------------------------------------------------------------+
| Search Results (Embedding Latency: 12ms):                                     |
|                                                                               |
| 1. docker__restart_container  [Score: 2.942] 🟢 High Match                    |
|    "Restart a running Docker container by name or container ID."              |
|                                                                               |
| 2. docker__stop_container     [Score: 1.815] 🟡 Moderate                      |
|    "Stop a running Docker container."                                         |
|                                                                               |
| 3. caddy__reload_config       [Score: 1.748] 🟡 Moderate                      |
|    "Triggers an in-process reload of the Caddy web reverse proxy config."     |
+-------------------------------------------------------------------------------+
Understanding the Score Breakdown
The score represents a hybrid composite of vector similarity and keyword boosting:
* Vector Cosine Similarity (0.00 – 1.00): Computed using the 384-dimensional embedding vectors generated by Local ONNX (all-MiniLM-L6-v2) or remote embedding API.
* Exact Substring Boost: Adds +2.0 if the tool name contains the query, or +1.5 if the description contains the query.
* Per-Word Token Match Boost: Adds +1.0 per word match on the tool name, and +0.5 per word match on the description.
* Multi-Word Bonus: Adds compound match multipliers when multi-word intent phrases match across metadata.
API & cURL Example
curl -X POST http://localhost:8080/api/test/semantic-search \
  -H "Authorization: Bearer <YOUR_APP_KEY>" \
  -H "Content-Type: application/json" \
  -d '{
    "query": "restart web proxy container"
  }'
💻 5. Direct JSON-RPC Raw Console (ConsoleCard)
Send raw JSON-RPC 2.0 payloads directly to the gateway router:
+-------------------------------------------------------------------------------+
| 💻 Direct JSON-RPC Raw Console                                                |
+-------------------------------------------------------------------------------+
| Request:                                                                      |
| {                                                                             |
|   "jsonrpc": "2.0",                                                           |
|   "id": 1,                                                                    |
|   "method": "tools/list",                                                     |
|   "params": {}                                                                |
| }                                                                             |
|                                                                               |
| [ 🚀 Send Request ]                                                           |
+-------------------------------------------------------------------------------+
| Response (200 OK):                                                            |
| {                                                                             |
|   "jsonrpc": "2.0",                                                           |
|   "id": 1,                                                                    |
|   "result": { "tools": [...] }                                                |
| }                                                                             |
+-------------------------------------------------------------------------------+
Useful Raw JSON-RPC Payloads for Testing
1. Discover Meta-Mode Tools
2. Perform Dynamic Semantic Tool Search
{
  "jsonrpc": "2.0",
  "id": 2,
  "method": "tools/call",
  "params": {
    "name": "search_tools",
    "arguments": {
      "query": "find active database connections"
    }
  }
}
3. Execute Downstream Target Tool via Meta-Mode
{
  "jsonrpc": "2.0",
  "id": 3,
  "method": "tools/call",
  "params": {
    "name": "execute_tool",
    "arguments": {
      "name": "postgres__list_connections",
      "arguments": {}
    }
  }
}
📟 6. Live Diagnostic Logs Terminal (LogsTerminalCard)
Positioned at the bottom of the Test Bench view, the Live Logs Terminal provides real-time visibility into internal router operations:
+-------------------------------------------------------------------------------+
| 📟 Live Diagnostic Logs & Gateway Activity             [ Clear ] [ Auto-Scroll ]|
| Filter: [ ALL ▾ ] [ INFO ▾ ] [ WARN ▾ ] [ ERROR ▾ ]                           |
+-------------------------------------------------------------------------------+
| [13:45:02.112] [INF] [McpSession:c8b4] Client authenticated as 'admin' via OIDC
| [13:45:02.115] [INF] [McpSession:c8b4] Initialized Meta-Mode stream (2 tools)
| [13:45:04.220] [INF] [ToolExecution] docker__restart_container invoked by admin
| [13:45:04.262] [INF] [ToolExecution] docker__restart_container completed in 42ms
| [13:45:10.512] [WRN] [HealthCheck] Backend 'plex' responded slowly (1250ms)
+-------------------------------------------------------------------------------+
Key Capabilities
- Thread-Safe In-Memory Stream: Streams live gateway logs without disk I/O bottlenecks.
- Automatic PII Redaction: Sensitive authorization headers, Bearer tokens, and secrets are automatically masked (
[REDACTED]). - Severity Filtering: Filter logs by
INFO,WARN, orERRORlevels. - Auto-Scroll & Freeze: Pin terminal scroll position while diagnosing active issues.
- One-Click Clear: Clear the buffer at any time via the
Clearbutton orDELETE /api/logs.